Revenue Per Chair Dental Practice: How to Calculate It
Revenue per chair is a simple yet powerful metric for dental practices. It shows how much income each operatory generates, helping you understand which chairs are contributing to your revenue and which may need improvement. Here’s the key takeaway:
- Formula: Total collections ÷ Number of chairs.
- Why it matters: It highlights underperforming surgeries, helps manage overhead costs (e.g., rent, wages), and improves scheduling efficiency.
- Example: A practice with £800,000 annual collections and 4 chairs has a gross revenue per chair of £200,000.
- Key factors: Utilisation rate (e.g., booked vs. available hours) and lab fees for private practices impact net revenue per chair.
Tracking this metric ensures your chairs are working efficiently to support your practice’s profitability. Empty chairs cost money, so focus on filling gaps in your schedule, improving patient flow, and optimising practitioner performance.
How I Doubled My Income as a Dentist (Step-by-Step)
What Revenue Per Chair Means and Why You Should Track It
Let’s break down what revenue per chair actually represents and why it matters.
Revenue per chair is a measure of the income generated by each operatory in your practice. It’s calculated by multiplying the number of patients seen per chair by the average revenue per patient [3]. This metric provides a clear picture of how much income each chair is contributing to your practice.
Now, this is different from total practice revenue - often referred to as Collections - which reflects the overall earnings of your business after adjustments for unpaid invoices and insurance claims [1]. While total revenue gives you a snapshot of your practice’s overall financial health, revenue per chair zooms in on the performance of individual operatories [2].
How Revenue Per Chair Differs From Total Practice Revenue
Think of total practice revenue as the big picture - it’s the sum of your practice’s earnings after accounting for adjustments like insurance claims and unpaid bills. Revenue per chair, on the other hand, is much more focused. It’s all about understanding how each individual chair is performing.
This distinction is especially useful when you need to identify which surgeries are thriving and which might need improvement. For private practices, subtracting lab fees can give a more accurate picture by reflecting fixed overheads. This granular view is essential for fine-tuning your operations.
Why UK Dental Practices Need to Monitor Revenue Per Chair
Understanding the difference between these metrics is key to spotting operational inefficiencies.
Tracking revenue per chair allows you to identify underperforming surgeries early, helping you address issues before they affect your bottom line. For NHS practices, this metric can be paired with UDA (Units of Dental Activity) forecasts to ensure that contracts are met and claims are submitted on time. Private practices can use a six-week forecast to identify scheduling gaps before they impact revenue [2].
It also informs staffing and scheduling decisions. If some practitioners generate less revenue despite working similar hours, it might be time to review training or adjust scheduling practices. Regular chair utilisation reports can highlight underused surgeries, helping you decide whether to reallocate staff or ramp up marketing efforts [2].
“The Practitioner Activity report provides all the information you need to see how efficient each individual is by monitoring a number of variants including; treatment type, duration, pricing, invoice date and payment date.”
Before expanding your practice - whether that means opening a new location or adding more chairs - ensure your current operatories are running at full capacity. If they’re not, simply adding more chairs won’t solve revenue problems. Instead, focus on improving scheduling and patient flow first [2].
How to Calculate Revenue Per Chair: Step-by-Step
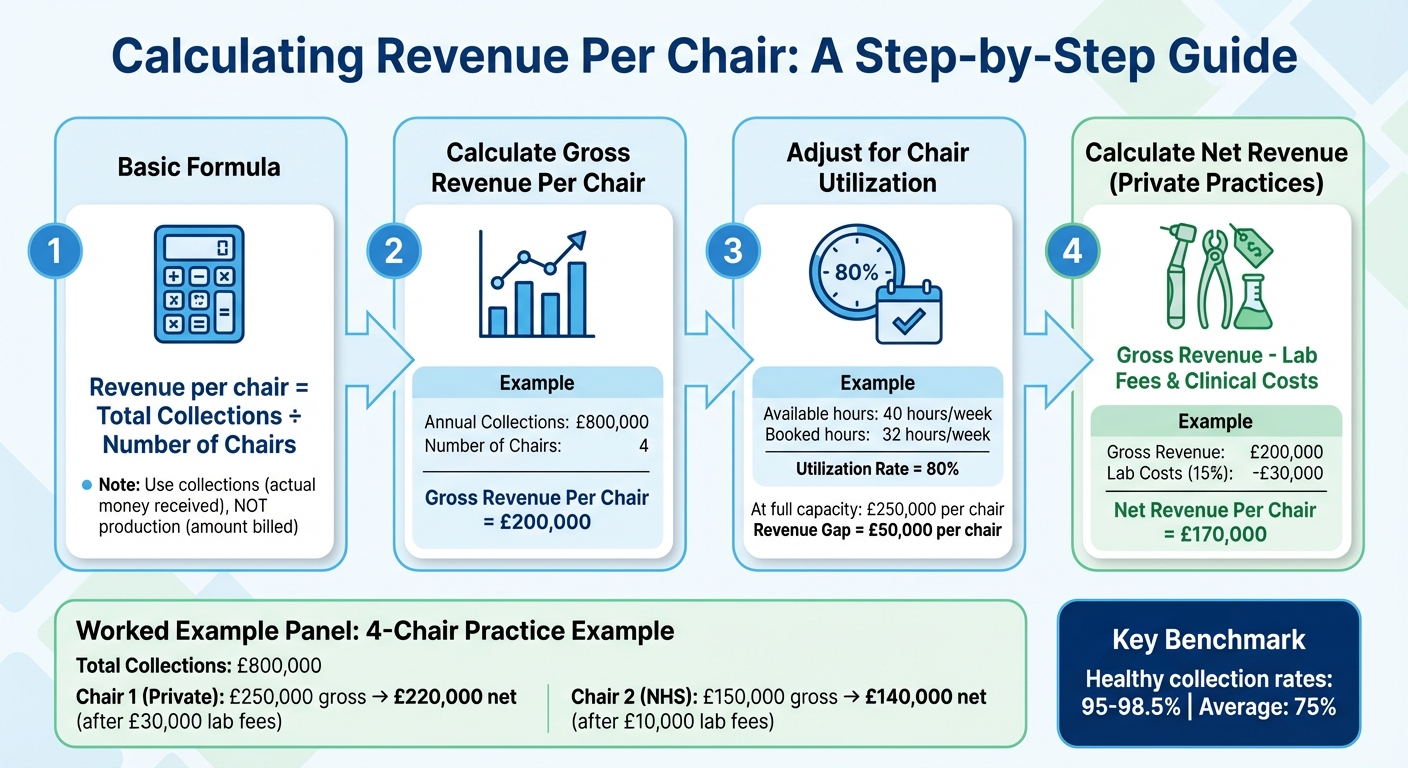
@figure {How to Calculate Revenue Per Chair for Dental Practices} :::
To calculate revenue per chair, use this formula:
Revenue per chair = Total Collections ÷ Number of Chairs [1].
Here, “collections” refers to the actual money received - not the amount billed. This distinction is crucial because production figures often include unpaid invoices and pending insurance adjustments that haven’t been cleared yet [1].
The Basic Formula for Revenue Per Chair
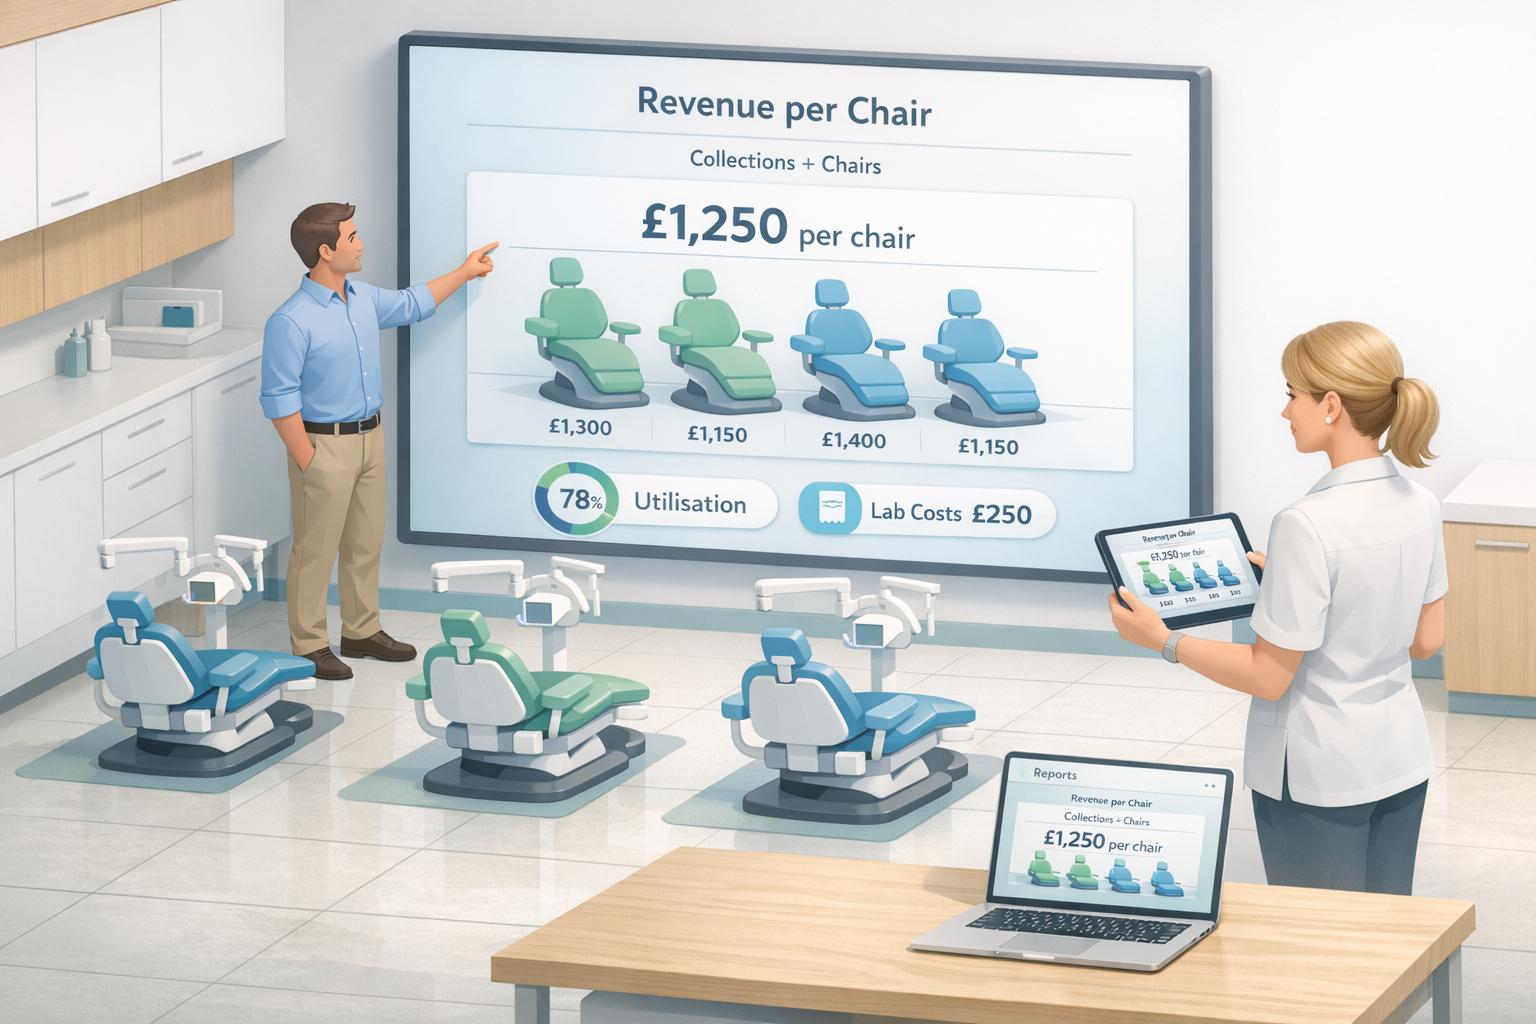
Begin with your total collections over a specific time frame, such as a month or a year. Divide this amount by the number of operational chairs in your practice. For instance, if your practice collected £800,000 last year and operates with four chairs, the gross revenue per chair would be £200,000.
Adjusting for Chair Use and Lab Costs
The utilisation rate of your chairs significantly affects revenue. For example, if your chairs are available for 40 hours per week but are only booked for 32 hours, the utilisation rate is 80%. At full capacity, each chair could generate £250,000, meaning there’s a £50,000 gap per chair due to underutilisation.
For practices focusing on private work, you’ll need to subtract lab fees and clinical supply costs to calculate Net Revenue Per Chair. If these costs average 15% of revenue (approximately £30,000 per chair), the net revenue per chair drops to £170,000. This net figure provides a clearer picture of what each chair contributes to overheads and profit.
These adjustments allow you to assess chair performance more accurately, helping you pinpoint areas for improvement to boost profitability. Here’s an example to bring these calculations to life:
Worked Example: Calculating Revenue Per Chair for a 4-Chair Practice
Let’s examine a real scenario: A four-chair practice in the UK collects £800,000 annually after NHS adjustments and uncollected private fees.
- Gross revenue per chair: £800,000 ÷ 4 = £200,000.
- Chair 1 focuses on private work, generating £250,000, while Chair 2 handles NHS patients, bringing in £150,000.
- After deducting £30,000 in lab fees from Chair 1, its net revenue is £220,000. Chair 2, with lower lab costs of £10,000, has a net revenue of £140,000 [2].
This breakdown highlights exactly where your profits originate, offering insight into how each chair contributes to your practice’s financial health.
How Chair Use Affects Your Revenue Per Chair
Empty chairs can silently drain your practice’s revenue. Fixed costs like rent and staff salaries don’t pause when your chairs sit idle, meaning every unfilled appointment slot adds to your expenses without bringing in income.
Chair utilisation is a key metric here - it tells you how effectively your appointment slots are being filled. For example, if only 32 out of 40 available hours are booked, that’s a 20% gap, which translates to substantial lost revenue. On average, practices see between 8 and 15 patients per chair daily [3]. Knowing where your practice stands in this range can help pinpoint inefficiencies.
How Empty Chair Time Reduces Practice Profit
Gaps in your schedule, whether caused by cancellations or no-shows, don’t just waste time - they increase your cost per visit. With staffing expenses typically accounting for 25–30% of overall costs [1], idle chairs can quickly eat into your bottom line.
“Research shows the average overhead for a practice in the U.S. can be as high as 70 or 75 percent… many consultants would say that a good target for general dentists could be closer to maybe sixty percent.” – Dr. Chris Salerno, Chief Dental Officer, Tend [3]
When overhead runs at 70–75% [3], every empty hour puts a dent in your profits. Keeping chairs consistently occupied is crucial just to maintain financial stability.
How to Increase Chair Use Without Overbooking
Filling those empty slots without overwhelming your team is the sweet spot. Here are some practical steps to boost chair use:
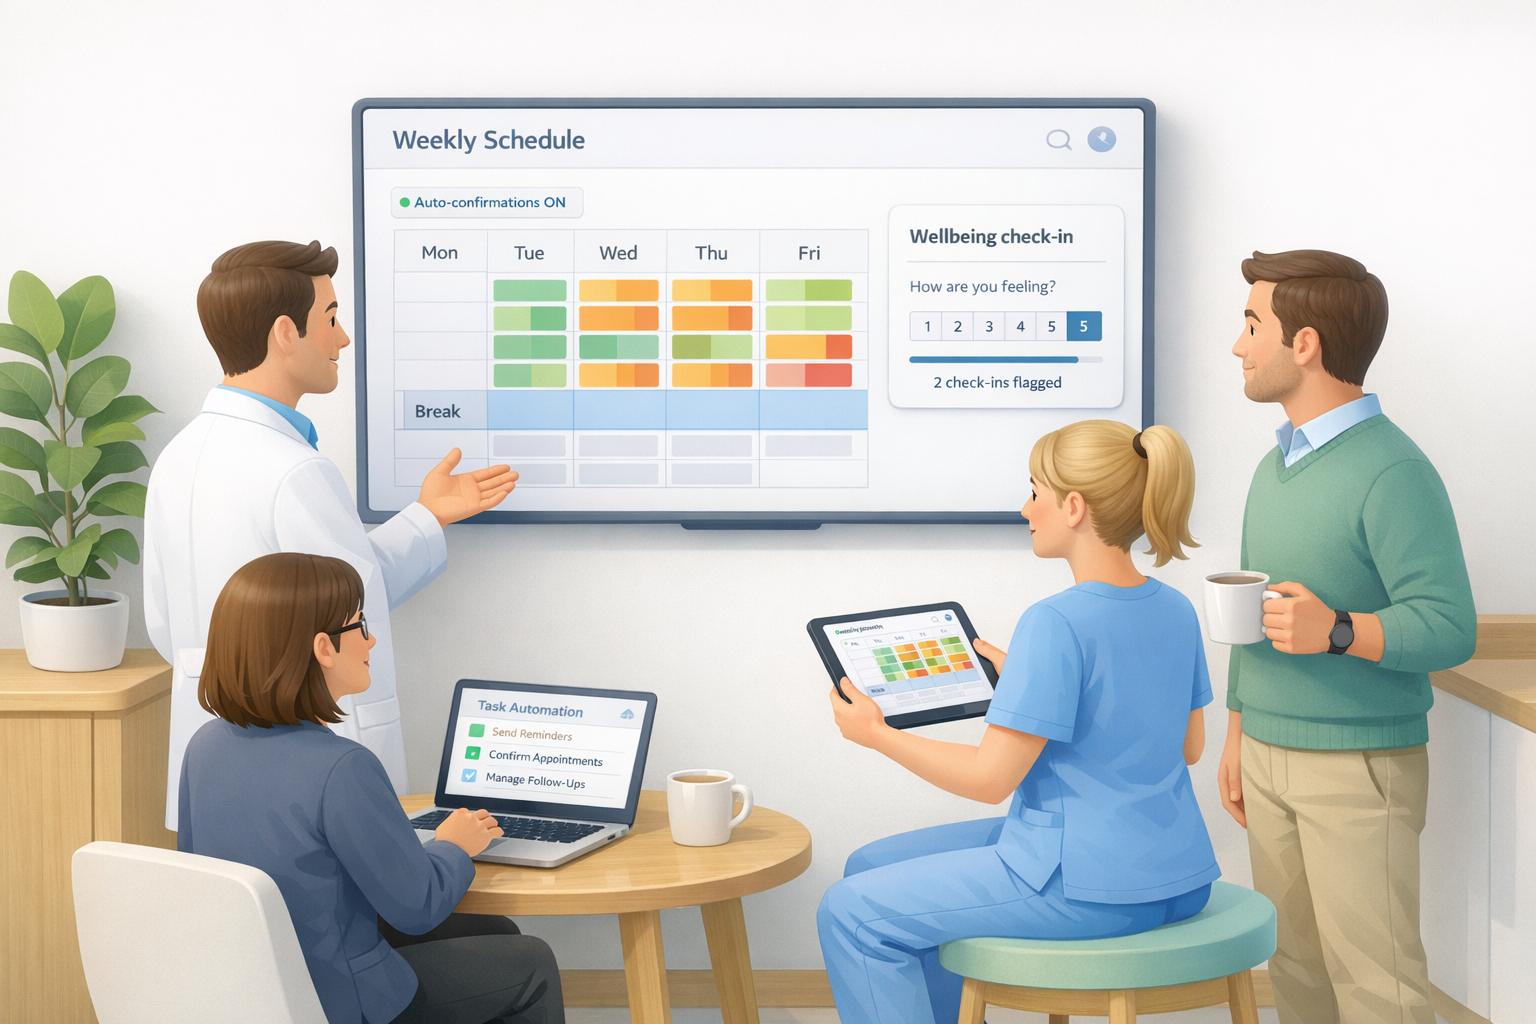
- Automate reminders: Reduce no-shows by sending appointment reminders through WhatsApp, SMS, or email 48 hours in advance. Tools like Remedico’s Smart Calendar can also identify and fill last-minute cancellations automatically, ensuring your chairs stay productive.
- Track utilisation: Review weekly reports to find underused surgeries or practitioners. A quick daily huddle can help spot scheduling gaps, address pending appointments, and align the team with daily production goals.
- Leverage unfinished treatments: Use ‘Unfinished Treatments’ reports to contact patients who’ve already agreed to procedures. This can help fill vacant slots quickly [2].
- Block scheduling for high-value tasks: Reserve specific time slots for high-profit treatments. For instance, morning slots could be dedicated to complex restorative work, while afternoons are set aside for hygiene appointments. This ensures your most valuable chair time is used efficiently without overbooking or compromising care [5][4].
3 Common Mistakes When Calculating Revenue Per Chair
Many practice owners grasp the basic formula but often overlook critical details. This can make revenue per chair figures seem more promising than they actually are, leading to decisions based on incomplete data.
Mistake 1: Not Accounting for Lab Costs in Private Practices
For private or mixed NHS/private practices, failing to factor in lab costs can inflate revenue figures. To get a more accurate picture, deduct lab expenses from your total collections before dividing by the number of chairs. This adjustment helps reveal the true contribution of each surgery.
Additionally, relying on billed figures rather than actual collections can further distort your calculations.
Mistake 2: Using Production Figures Instead of Collections
Production figures represent amounts billed, but collections show what’s actually been paid. The difference can be quite striking. Healthy practices typically see collection rates of 95–98.5%, while the average is closer to 75% [1][3].
“Being busy as a bee doesn’t always equate to a topped-off bank account… a higher average production per patient will.” – Angela Ledford, Director of Marketing, Adit [3]
Insurance reimbursements, which can take 30–90 days to arrive, further complicate things. Using production figures rather than collections can paint an inaccurate picture of your cash flow. To avoid this, always calculate revenue per chair using actual collections and keep an eye on your collection rate to identify potential billing issues. Remedico’s financial reporting can assist by clearly separating production from collections, ensuring you’re working with accurate data.
But billing isn’t the only factor to consider - external influences like seasonal and regional variations can also skew your numbers.
Mistake 3: Ignoring Seasonal and Regional Differences
Revenue per chair benchmarks vary significantly depending on practice type and patient demographics. For example, in the UK, a fully NHS practice generates around £142,058 per surgery annually, while a fully private practice can bring in approximately £250,345 [7] - a striking 76% difference.
“The timing of revenue can matter as much as the amount when it comes to paying your bills on time… insurance reimbursements can take 30–90 days to hit your bank account, while cash patients pay on the spot.” – Dr. Chris Salierno, Chief Dental Officer, Tend [3]
Comparing your figures to those of nearby practices without considering factors like NHS/private patient mix, patient demographics, or equipment-related debt can lead to flawed benchmarks [6]. Instead, focus on tracking your own month-over-month trends and use tools like UDA forecast reports for NHS work to better anticipate revenue fluctuations [2].
Key Takeaways for Calculating and Improving Revenue Per Chair
Here’s a quick breakdown of the main points to help you boost your revenue per chair.
Revenue per chair is calculated by dividing your total collections (not production) by the number of chairs over a specific period. If you run a private or mixed practice, make sure to subtract lab costs from your collections first. Focus on collections rather than billings, as healthy practices typically collect between 95% and 98.5%, compared to an average of just 75% [1][3].
Chair utilisation has a direct impact on profitability. Empty slots hurt revenue while fixed costs remain unchanged [3]. To address this, review weekly chair usage reports to spot gaps and follow up on unfinished treatments to fill those slots [2].
Monitoring individual performance can also reveal areas for improvement. Keep an eye on treatment times, pricing, and patient volume for each practitioner. This can help you identify where additional training or scheduling tweaks might be needed [2]. Instead of comparing your performance to other practices, focus on tracking your own month-over-month trends. External benchmarks often fall short due to differences in NHS/private mixes, patient demographics, and regional factors [6][7].
Remedico’s Owner’s Dashboard simplifies the process by consolidating key metrics like revenue, chair usage, and practitioner performance. It automatically distinguishes production from collections, tracks unfinished treatments, and highlights which chairs are meeting income expectations. By integrating seamlessly with your practice management system, it eliminates the need for manual spreadsheets and provides the data you need to make smarter decisions.
FAQs
How many chairs should I count?
Counting the dental chairs actively used in your practice is essential for understanding your operational capacity and its impact on revenue. Focus on the chairs in operatories that are consistently used for patient treatments. For instance, if your practice has six chairs but only four are in regular use, base your calculations on those four.
It’s a good idea to periodically review how your chairs are being utilised. This helps you spot any underused or surplus capacity, allowing you to make adjustments that can boost your practice’s efficiency and revenue. :::
Should I calculate revenue per chair monthly or yearly?
It’s a good idea to calculate revenue per chair on a monthly basis. This helps you keep a close eye on performance and identify trends as they emerge. On the other hand, reviewing it annually gives you a bigger picture of your practice’s profitability and overall growth over time. :::
What’s a good revenue per chair in the UK?
A healthy revenue per chair in the UK generally ranges from £250 to £350 per day, influenced by factors like the practice’s size and location. For most dental practices, an average benchmark of £250–£300 per day per chair is often considered a dependable standard. :::